Facility managers often ask, “what is the ROI of switching to LED high bays?” The answer is not a single percentage. It depends on fixture wattage, operating hours, electricity rates, maintenance costs, controls, and installation expenses. A 100,000-square-foot warehouse may run high bays for 4,000 hours annually. Replacing 400-watt metal halide fixtures with 150-watt LEDs can reduce lighting demand substantially. However, the real result depends on actual usage.
Amory Lovins, energy-efficiency expert and cofounder of RMI, said, “The cheapest, cleanest energy is the energy you don’t use.” That principle explains why LED high bays can deliver value beyond lower utility bills. LEDs may also reduce relamping work, lift rentals, production interruptions, and disposal costs. Their longer service life matters in buildings with tall ceilings.
The calculation should begin with measurable evidence. Record each fixture’s wattage, annual operating hours, energy rate, and replacement cost. Include labor, controls, rebates, financing, and expected LED life. Then compare annual savings against the project’s total installed cost. Simple payback is useful, but it is incomplete. Net present value and internal rate of return can reveal whether the upgrade remains attractive over ten years.
The first estimate may be wrong. Utility rates change. Rebate programs expire. Some facilities operate fewer hours than managers assume. A reliable ROI analysis tests conservative, expected, and optimistic scenarios. It should also verify light levels, glare, color quality, and worker needs. Savings are valuable, but poor visibility can create a different operational cost.
Define the Costs and Energy Use of Existing High Bay Fixtures
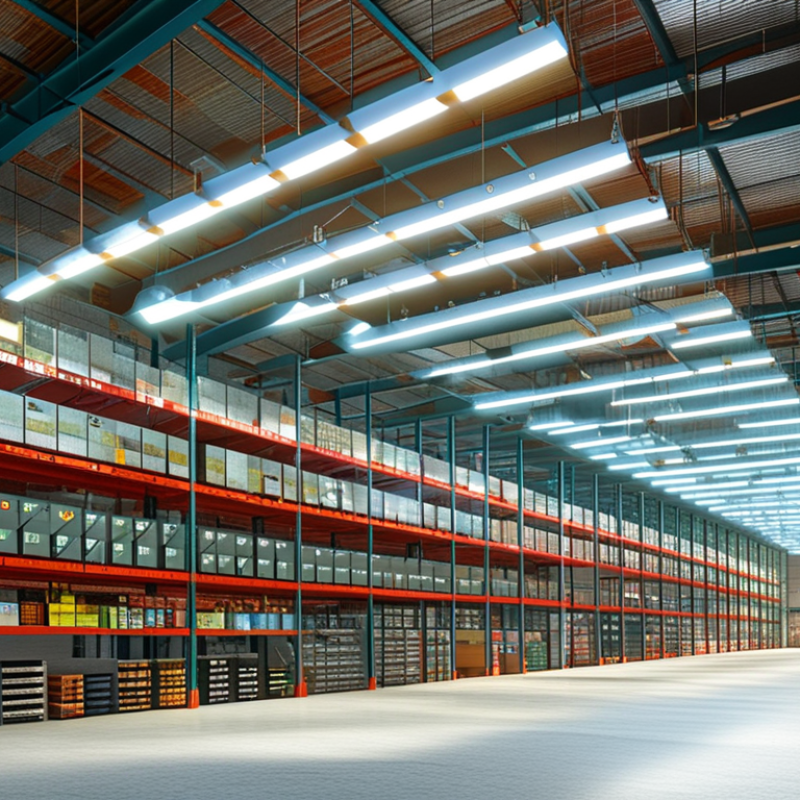
Before estimating LED savings, document what the current high bay system actually costs. An equipment schedule should list fixture quantity, lamp wattage, ballast wattage, and operating hours. A 400-watt lamp may draw more than 400 watts after ballast losses. That difference matters.
Walk through the facility during a normal shift. Record how many fixtures operate, when they turn on, and whether controls are used. A simple plug-in power meter can verify consumption for compatible equipment. For larger systems, an electrician can measure circuit load safely. Avoid relying only on old invoices. They often combine lighting with heating, equipment, and seasonal demand charges.
Use this calculation: annual energy cost equals total watts multiplied by operating hours, divided by 1,000, then multiplied by the electricity rate. For example, 80 fixtures drawing 460 watts for 4,000 hours use about 147,200 kilowatt-hours annually. At 0.14 dollars per kilowatt-hour, energy costs reach approximately 20,608 dollars. Add relamping labor, replacement lamps, ballast repairs, lift rental, and disposal fees. Include demand charges when the utility applies them.
Measurements are rarely perfect. A remembered wattage can mislead. Check the fixture label, utility bill, and operating schedule together. My practical preference is to record one month of real usage before finalizing the ROI model. Differences may reveal missed fixtures, idle areas, or controls that were assumed but never installed.
Estimate LED High Bay Installation and Operating Expenses
How to Calculate the ROI of Switching to LED High Bays?
Estimate every installation and operating expense before calculating payback. Include fixtures, mounting hardware, wiring changes, lift rental, labor, controls, disposal, and permit costs. A warehouse with 100 high bays may need more than fixture replacement. Ceiling height can make labor surprisingly expensive. My first estimate was too optimistic because I ignored lift rental.
Use measured system wattage, not the lamp label. Suppose each existing high bay draws 300 watts, while the LED replacement draws 150 watts. At 4,000 operating hours and $0.14 per kilowatt-hour, annual energy savings reach approximately $8,400 for 100 fixtures. The formula is simple: wattage reduction × fixture count × annual hours ÷ 1,000 × electricity rate. The U.S. Department of Energy reports that quality LED systems can deliver substantially higher efficacy and longer service life than traditional lighting technologies. However, real savings depend on controls, operating schedules, and actual power demand.
Maintenance deserves separate attention. The International Energy Agency identifies lighting as a significant share of global electricity use, making efficiency improvements financially relevant at scale. ENERGY STAR guidance also notes that LEDs generally last far longer than incandescent sources, but high-bay environments still require cleaning and occasional driver replacement. If installation costs $30,000 and annual energy and maintenance savings total $10,000, simple payback is three years. That figure can change after rebates, demand charges, reduced lamp access, or unexpected rewiring. Measure one zone first. Then revise the estimate.
Calculate Energy, Maintenance, and Replacement Savings
How to Calculate the ROI of Switching to LED High Bays?
A reliable LED high bay ROI calculation starts with real operating data. Record each fixture’s wattage, operating hours, electricity rate, and quantity. Then compare the existing system with the proposed LED system. Energy savings equal reduced watts multiplied by operating hours and electricity cost. For example, replacing a 400-watt fixture with a 200-watt model can save 200 watts per fixture. At 12 hours daily, that difference becomes substantial across a large warehouse. Use utility bills, not guesses, whenever possible. Small rate changes matter.
Maintenance savings can be equally important. Track lamp replacements, lift rentals, labor time, and emergency service calls over the past year. LED high bays often reduce relamping work because they use longer-lasting components. Fewer failures also mean less disruption near aisles, loading areas, and production lines. Include the cost of replacement lamps and disposal. Do not count every avoided repair as guaranteed savings. Conditions vary.
Replacement savings deserve careful attention. Compare the expected service life of the current fixtures with the LED system’s rated life. A practical formula is: ROI = (energy savings + maintenance savings + replacement savings − project cost) ÷ project cost. Consider installation labor, controls, wiring changes, and permits. Payback may look attractive on paper, but poor lighting layouts can create hidden costs. I have seen projects overestimate savings by ignoring reduced operating hours. Review the assumptions with an electrician or facility manager, then test a small area before approving a full conversion. Real measurements often challenge the first estimate.
How to Calculate the ROI of Switching to LED High Bays?
Compare five-year energy, maintenance, and replacement costs for 100 high-bay fixtures operating 4,000 hours per year.
Key result: Switching to LED high bays reduces estimated five-year operating costs from $112,500 to $48,000. With an estimated initial LED investment of $35,000, the five-year net savings are $29,500, producing an estimated ROI of 84.3% and a payback period of approximately 2.7 years.
Assumptions: 100 fixtures, existing 250 W fixtures replaced by 150 W LED fixtures, 4,000 operating hours per year, electricity at $0.12 per kWh, existing-fixture maintenance at $45 per fixture annually, LED maintenance at $12 per fixture annually, existing-fixture replacement cost of $180 every three years, LED replacement cost of $120 every ten years, and an LED installation cost of $350 per fixture.
Measure Payback Period and Return on Investment
How to Calculate the ROI of Switching to LED High Bays?
Start with measured operating data, not a sales estimate. Record fixture wattage, quantity, operating hours, electricity rates, and maintenance costs. Simple payback equals total project cost divided by annual savings. Use real bills.
Consider a warehouse with 200 fixtures. Replacing 250-watt metal halide units with 150-watt LED high bays reduces connected load by 20 kilowatts. At 3,600 operating hours annually, the modeled energy saving reaches 72,000 kilowatt-hours.
At $0.12 per kilowatt-hour, that equals $8,640 yearly. The U.S. Energy Information Administration publishes regional commercial electricity prices, so use your local tariff rather than a national average.
The U.S. Department of Energy also reports that LED lighting generally offers longer life and lower energy use than conventional technologies. Maintenance savings should be included, but only when supported by service records.
Suppose installation costs $40,000, with $1,500 saved annually through relamping and labor. Annual benefit becomes $10,140, producing a payback period of about 3.9 years. The first-year ROI is approximately 25.4%, calculated as annual benefit divided by project cost.
Check rebates separately. They can shorten payback. The model is useful, but imperfect. Occupancy changes, dimming schedules, temperature, and emergency repairs can distort results. A spreadsheet may look precise while hiding weak assumptions. Recalculate ROI after six and twelve months using utility bills, lighting schedules, and actual maintenance invoices. Short-term savings can disappoint. Long-term performance may still improve.
Evaluate Long-Term Financial and Operational Benefits
How to Calculate the ROI of Switching to LED High Bays?
Replacing high bays is not only an energy project. It changes maintenance, safety, and daily operating costs. The International Energy Agency reports that lighting uses about 15% of global electricity. The U.S. Department of Energy also reports LED laboratory efficacy above 200 lumens per watt, although real warehouse performance may be lower. Measure carefully.
Calculate annual energy savings with this formula: (old fixture watts − LED watts) × operating hours × electricity rate ÷ 1,000. Add maintenance savings, including relamping labor, lift rental, and production downtime. Then compare the total with purchase and installation costs. For example, a 400-watt fixture replaced by a 150-watt unit, operating 4,000 hours yearly at $0.12 per kilowatt-hour, saves about $120 annually in electricity. Controls may increase savings, but poor sensor placement can reduce them. That part is often overlooked.
Tips: Record actual operating hours for four weeks. Request photometric data, not only lumen claims. Check rebate eligibility before purchasing. Compare five-year net savings, payback, and expected replacement cycles. A longer warranty is useful, but it does not prove better performance. Dust, heat, ceiling height, and voltage conditions can reduce life. Site measurements may reveal that fewer fixtures provide adequate illumination, but cutting fixtures too aggressively can create dark aisles and slower work. The final ROI should include comfort and maintenance risk, not just the utility bill.
How to Calculate the ROI of Switching to LED High Bays?
Evaluate Long-Term Financial and Operational Benefits
| Evaluation Dimension |
Existing High Bays |
LED High Bays |
Calculated Impact |
Five-Year Financial Effect |
| Facility and Operating Assumptions |
| Number of fixtures |
100 fixtures |
100 fixtures |
One-for-one replacement |
Replacement scope remains constant |
| Operating schedule |
10 hours/day |
10 hours/day |
3,000 hours/year |
15,000 operating hours over five years |
| Electricity rate |
$0.12/kWh |
$0.12/kWh |
Constant planning rate |
Actual results vary with utility pricing |
| Fixture power rating |
400 W |
150 W |
62.5% lower connected load |
225,000 kWh avoided |
| Expected service life |
Approximately 15,000 hours |
Approximately 50,000 hours |
LED service life is approximately 3.3 times longer |
Fewer replacement cycles during the analysis period |
| Annual Energy and Maintenance Comparison |
| Annual electricity consumption |
120,000 kWh |
45,000 kWh |
75,000 kWh saved per year |
375,000 kWh saved |
| Annual electricity cost |
$14,400 |
$5,400 |
$9,000 saved per year |
$45,000 saved |
| Estimated annual maintenance cost |
$4,500 |
$1,200 |
$3,300 saved per year |
$16,500 saved |
| Total annual operating cost |
$18,900 |
$6,600 |
$12,300 saved per year |
$61,500 saved |
| Estimated maintenance visits |
20 visits/year |
5 visits/year |
75% fewer visits |
Approximately 75 fewer visits over five years |
| Investment and ROI Calculation |
| LED fixture and installation cost |
Not applicable |
$300 per fixture |
$30,000 initial investment |
$30,000 total project cost |
| Simple payback period |
Not applicable |
2.44 years |
Initial investment ÷ annual operating savings |
Investment recovered during Year 3 |
| Five-year gross operating savings |
Not applicable |
$61,500 |
Annual savings × five years |
$61,500 |
| Five-year net savings |
Not applicable |
$31,500 |
Gross savings − initial investment |
$31,500 |
| Five-year simple ROI |
Not applicable |
105.0% |
(Net savings ÷ initial investment) × 100 |
105.0% return over five years |
| Five-year NPV at 8% discount rate |
Not applicable |
$19,100 |
Present value of annual savings less initial investment |
Positive financial value |
| Operational and Environmental Benefits |
| Estimated annual carbon-dioxide reduction |
Baseline |
Approximately 29 metric tons avoided |
Based on 0.386 kg CO₂ per kWh |
Approximately 145 metric tons avoided over five years |
| Relamping and lift-equipment disruption |
More frequent access requirements |
Reduced access requirements |
Less production disruption and lower work-at-height exposure |
Operational benefit increases as fixture count and ceiling height rise |
| Light-output consistency |
Output typically declines as lamps age |
More consistent output over the rated life |
Supports more stable illumination between maintenance cycles |
Potential productivity and safety benefits should be measured separately |
| Sensitivity Analysis |
| Scenario |
Electricity Rate |
LED Power / Project Cost |
Annual Operating Savings |
Five-Year ROI / Payback |
| Conservative case |
$0.08/kWh |
200 W / $35,000 |
$6,800 |
-2.9% ROI / 5.15 years |
| Base case |
$0.12/kWh |
150 W / $30,000 |
$12,300 |
105.0% ROI / 2.44 years |
| High-savings case |
$0.18/kWh |
120 W / $25,000 |
$19,120 |
282.4% ROI / 1.31 years |
Calculation basis: annual energy use = fixture quantity × fixture wattage × annual operating hours.
Simple ROI = (five-year operating savings − initial investment) ÷ initial investment × 100.
The model excludes taxes, rebates, financing costs, electricity-demand charges, depreciation, and changes in operating hours.
Maintenance figures are planning estimates and should be replaced with site-specific labor, access-equipment, lamp, ballast, and disposal costs.
Conclusion
Calculating the ROI of switching to LED high bays begins with a clear review of your existing lighting system. Record the number, wattage, operating hours, energy rates, maintenance requirements, and replacement history of current high bay fixtures. Then estimate the full cost of the LED upgrade, including equipment, installation, controls, disposal, and ongoing electricity use. Comparing these figures creates a realistic picture of the investment rather than focusing only on the initial purchase price.
To determine what is the ROI of switching to LED high bays, measure annual energy savings, reduced maintenance expenses, and avoided replacement costs. Use these savings to calculate the payback period and compare total benefits with the original investment. A complete evaluation should also consider long-term advantages such as improved lighting performance, longer service life, fewer disruptions, better operational efficiency, and more predictable facility expenses.